Histogram (from Internet Glossary of Statistical Terms)
Statistics Explained
Histogram

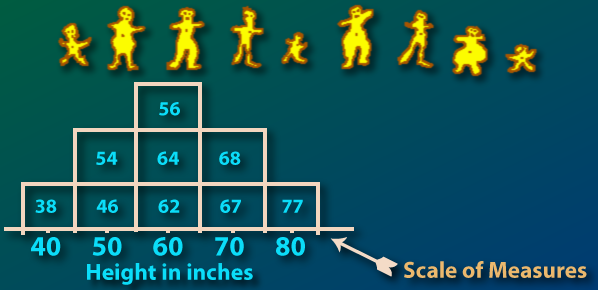
A histogram is a way of graphically showing the characteristics of the distribution of items in a given population or sample. Here is a histogram of the measures of height in the illustrated population. In a histogram each measure is represented by a single block that is placed over the midpoint of the class interval into which the measure falls.

The measures of the heights in inches of the individuals shown below are: 56, 54, 64, 68, 38, 46, 62, 67 and 77.

Image for Histogram

Go to web page describing Statistics Explained

Only $19.95!

  • Learn the logic behind fundamental statistical concepts!
  • 100 modules -- Get a solid grounding in basic statistical reasoning!
  • Call us toll free to order a CD-ROM or use our Automated Secured Transaction System to download the complete program now.
  • Written by:
    Howard S. Hoffman, Professor Emeritus of Psychology, Bryn Mawr College
    Programming by:
    Russell D. Hoffman, Owner and Chief Programmer, The Animated Software Company

  • Click here for more information!


Catalog / Site Map / Company Home page / Contact / Product Home Page


Last modified February, 2002
Webmaster: Russell D. Hoffman
Copyright (c) Russell D. Hoffman